Monitoring and Tuning Verbose GC with Introscope EPAgent

Tuning garbage collection (GC) can be a difficult task without the right data, analysis tools and understanding of the runtime. With the help of the Introscope EPAgent and verbose gc logging I'll show you how to collect the data you need to be able to monitor and tune your runtimes GC!
A number of tools exist to analyze verbose gc log files, my personal favorite is IBM PMAT. PMAT gives some pretty graphs showing gc pattern analysis, allocation failures and more. Feel free to read more about PMAT here. The problem with PMAT is the time it takes to collect all the log files, and process them. Even on my loaded laptop with multiple cores and GigE connections it takes a few hours to get a report.
Our environment is pretty big. Running multiple cells, with hundreds of app servers, across multiple OS's and environments with high volumes. Our GC logs are a few hundred MB on average with the level of GC we output. We needed a way to monitor the GC logs in real time as well as having the ability to view historical data for baselines.
Introscope EPAgent came to the rescue! The EPAgent gives us the ability to monitoring log files and report the data back to the Enterprise Manager in real time. As GC data was written to the log files we would be able to collect it using Introscope. This gives us the ability to pull up historical information to use as baseline data to improve upon. As applications evolve we can easily review the data as part of our performance tuning process and report on it! As with any Introscope metrics we can also alert on them.
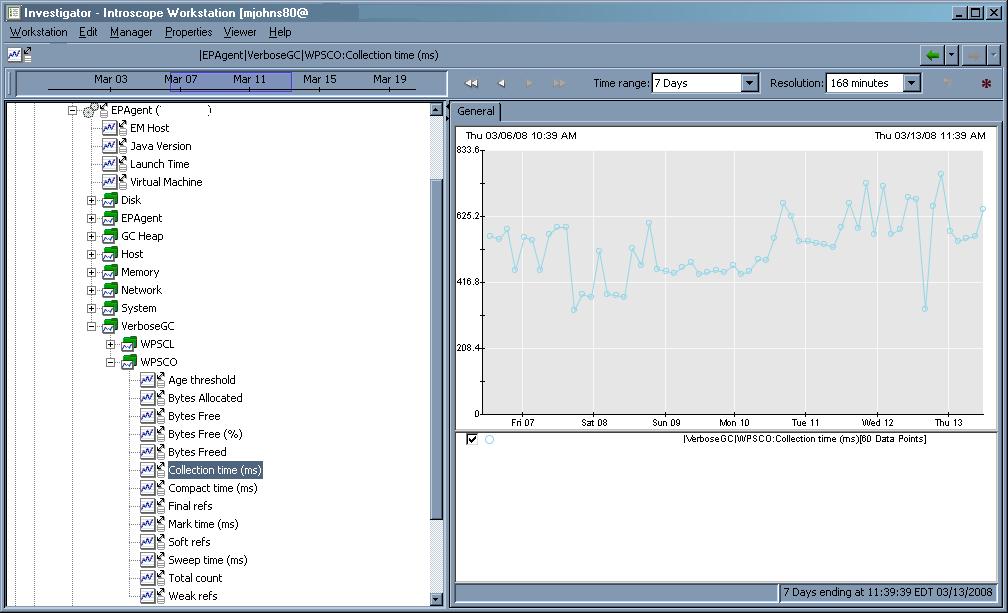
Here is a screenshot of the metrics this app server was collecting:

The setup is simple and I've put together a zip file of the perl script and EPAgent config file needed get done!
Download Here
Read more!